Markov Analysis
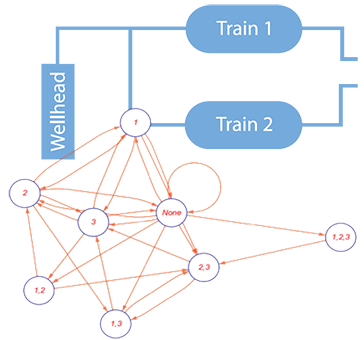
Reliability engineering often starts with a ‘screening assessment’ founded on the ubiquitous exponential model, however, it soon becomes apparent that real systems are not comprised of discrete, statistically independent, components. Systems reliability estimates based on the simple product of component failure probabilities are therefore inaccurate and possibly misleading. Real systems have more complex behavior in that the failure of one component may increase the likelihood of other component failures, this makes enumeration far more complex, even for relatively simple ‘systems’. As an example, failure of a component brought about by operating some equipment in temperatures that were not envisaged during design will increase the likelihood of other components failing within the same time period. So how do we model the fact that ‘entering a failed state’ in one component increased the rate of other components failing? In the real world reliability and availability is non-obvious as shown below:
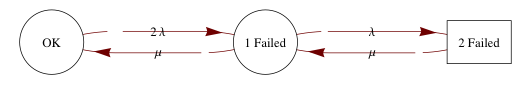
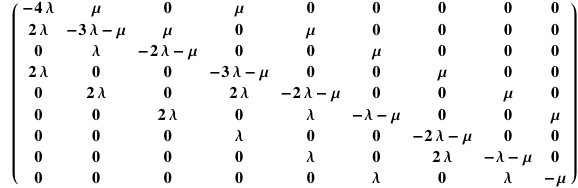
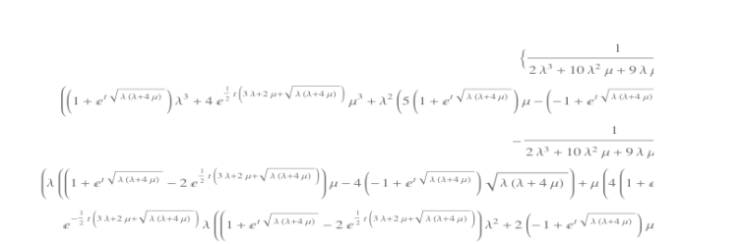
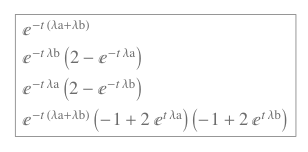
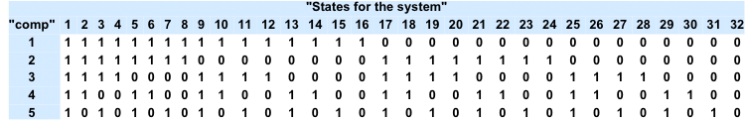
State-space models provide a framework for developing state-transition models: that’s a fancy way of saying we can enumerate the behavior of real systems by constructing a matrix-based description of the system. The final step is to solve the corresponding set of simultaneous first order differential equations so that we can determine the ‘rate’ at which the system enters the failed state.
Real world dependencies that can be handled using Markov models are
- - Components in cold or warm standby
- - Common maintenance personnel
- - Common spares with a limited on-site stock
At first sight Markov methods seem like a good way of enumerating systems behavior: however large systems result in exceedingly complicated enumeration, furthermore, they are always based on the notion of a constant failure rate. Markov models should therefore be used to analyze smaller systems with strong dependencies requiring accurate evaluation. Other analysis techniques, such as fault tree analysis, may be used to evaluate large systems using simpler probabilistic methods however these rely on independence. Large safety-critical systems, with strong component dependencies should therefore be analyzed using Berkeley & Imperial’s network analysis tools.