Bowtie Method
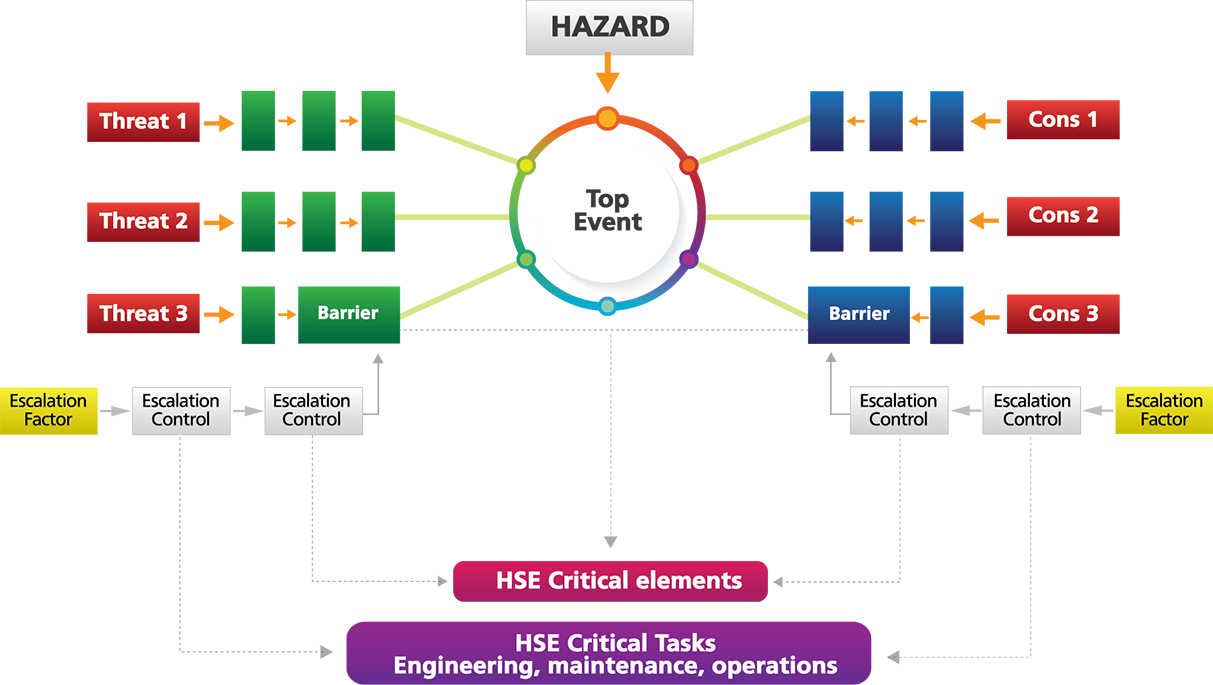
The bowtie method is a simple, qualitative, process for documenting the causal relationships between threats and consequences. The method takes its name from the shape of an illustration of the method like the one shown in Figure 1. In its simplest form, a bowtie diagram provides a visual summary of the measures taken to prevent, detect, control, and mitigate, an ensemble of accident scenarios corresponding to a specific hazard. The left hand side of a bow tie captures the threats, and barriers, and the right hand side captures the recovery measures. The centre of the diagram is referred to as the top event, and corresponds to the common hazardous event resulting from failure to control the threats.
Factors that can impair each barrier and recovery measure can be included in the bowtie and are referred to as escalation factors and escalation controls.
The bow tie diagram evolved during the 1970s from the ‘safety barrier’ concept used in the Process and Drilling industries. The method was developed into a simple graphical tool for capturing the risk management measures associated with a specific hazard. The assessment begins with the identification of hazards, which are then reviewed by a competent team to identify the threats that can ‘release’ the hazard. Each threat must be controlled by suitable and sufficient ‘barriers’ which may be physical items or operational measures. Every barrier and recovery measure is then assessed to determine whether escalation factors can potentially impair their performance. For example, inadequate inspection and maintenance is an escalation factor that could result in the failure of an emergency shutdown valve. In practice, many threats can lead to essentially the same top event; for example, corrosion, erosion and over-pressuring in a pipeline are all threats that could cause a loss of containment. This leads to the grouping of threats by top event. Likewise, a single top event can give rise to one or more hazardous consequences.
A key strength of the bowtie method is derived from the fact it allows us to document the contribution of human and organizational factors in a format easily communicated to the workforce and Leadership. In cases where it is applied carefully, it is also possible to gain insight into the likely redundancy and effectiveness built into a companies hazard management plan, the method is therefore helpful when assessing conceptual designs, and managing change during operations. The method is also used by a wide range of industries to demonstrate risks are ‘as low as reasonably achievable’ (United States ALARA principle), and ‘as low as reasonably practicable’ (United Kingdom ALARP principle). Note, however, the method should not replace an appropriate level of dependability analysis during the conceptual and detailed engineering phases of a project.